True peak vs sample peak: what dBTP means, and why masters stop at -1 dBTP
A sample peak meter reads the stored samples; a true peak meter estimates the waveform your converter plays between them. Learn how they differ, how dBTP is measured, and where the -1 dBTP ceiling comes from.
A sample peak meter shows the largest value stored in the file. A true peak meter estimates the highest point of the waveform your converter actually plays, which can sit between two samples and above both of them. On a quiet mix the two readings agree closely. On a loud, limited master they can disagree by enough to decide whether the last decibel is clean or clipped on playback.
What does a sample peak meter miss?
Digital audio stores the signal as a series of samples. Your converter does not play those points as steps; it reconstructs a smooth waveform that passes through them. Between two samples, that waveform can rise higher than either sample. The highest point of the reconstructed wave is the true peak. A peak that occurs between samples is called an inter-sample peak.
The clearest example is a sine wave at a quarter of the sample rate, 12 kHz at 48 kHz, with its peaks falling exactly halfway between samples. Every sample then lands at 70.7 percent of the wave's height. If the wave peaks at full scale, every sample reads 0.707, so the sample peak meter shows -3.01 dBFS while the wave itself reaches 0 dBFS. Normalize that file to a 0 dBFS sample peak and the waveform the converter rebuilds goes 3 dB past full scale.
Music rarely lines up that neatly, but loud masters produce inter-sample peaks all the time. Heavy limiting and clipping square off the tops of waveforms, and a squared-off shape reconstructed through a filter overshoots. That is why a master whose sample peaks stop at -0.1 dBFS can read above 0 dBTP.
How is true peak measured?
ITU-R BS.1770, the standard behind LUFS meters, describes the method in its Annex 2. At 48 kHz the signal is oversampled four times, to 192 kHz, low-pass filtered, and the largest absolute value of the oversampled signal is read and expressed in dBTP. For a 96 kHz signal, the standard says two times oversampling is sufficient.
The result is still an estimate. Oversampling finds more points on the waveform, not every point, so a true peak meter can read slightly low. BS.1770 gives the worst case as a formula of the oversampling ratio and the signal's frequency:
| Oversampling | Worst under-read, content up to 0.45 of the sample rate | Worst under-read, at the Nyquist frequency |
|---|---|---|
| 4x (the BS.1770 method) | 0.554 dB | 0.688 dB |
| 8x | 0.136 dB | 0.169 dB |
EBU Tech 3343, the EBU's production guidelines, makes the link to the ceiling explicit: leaving 1 dB below full scale accommodates the potential under-read of about 0.5 dB of a 4x meter at 48 kHz, and that is why the maximum true peak level in production is -1 dBTP. Interpolating between the oversampled points narrows the error further. The detector in Clearwall Limiter, for example, oversamples 8x and then fits a parabola through the highest points, which reads within 0.0032 dB of the true peak on a 20 kHz sine at 44.1 kHz.
Where does -1 dBTP come from?
Several bodies and services name a true peak limit. They agree on -1 dBTP as a starting point and on going lower when a lossy codec is involved:
| Source | True peak guidance | Context |
|---|---|---|
| EBU R 128 (2023) | Not above -1 dBTP in production | Broadcast. Lower limits may apply to some distribution systems and data reduction rates |
| EBU Tech 3343 and 3344 | -2 dBTP before MPEG-1 Layer II and Dolby AC-3; a -2 dBTP limiter before the encoder | Broadcast distribution. Lower again at low bit rates |
| AES TD1004 (2015) | Not above -1.0 dBTP | Streaming. 256 kbps coders may work at -0.5 dBTP; lower bit rates may need less than -1.0 |
| Spotify | Below -1 dBTP; below -2 dBTP if the master is louder than -14 LUFS integrated | Delivery for streaming, including lossless |
| Apple Digital Masters | At least 1 dB of headroom | Oversampling in playback, commonly four times, can clip a master at 0 dBFS |
Spotify's page adds a detail worth knowing: when it turns a quiet track up to its -14 LUFS playback level, it leaves 1 dB of headroom for lossy encoding. Its example is a track at -20 LUFS with a true peak of -5 dBFS, which is lifted only to -16 LUFS. The track's own peaks set how far it can be raised.
What does lossy encoding do to peaks?
An AAC, MP3, Ogg Vorbis or Opus encoder throws away detail it judges inaudible and stores the rest with less precision. The decoded waveform is close to the original but not identical, and the small errors add to the peaks. A master that measured -1.0 dBTP as a WAV can decode higher.
We measured this while developing Clearwall. Four mixes mastered to -8 LUFS against a -1 dBTP ceiling were encoded with five lossy codecs and decoded again. The median decoded true peak was -0.09 dBTP: nearly the whole decibel of headroom was used by the codec. Holding the ceiling 1 dB lower (-2 dBTP) moved the median to -0.95 dBTP, and even then the low-bit-rate encodes of the dense mixes (AAC 128, Opus 128 and Vorbis 160 kbps) still decoded above 0 dBTP. The AES notes the same pattern: lower bit rates overshoot more.
So -1 dBTP is a margin, not a guarantee for every codec. For a loud master headed to streaming, -2 dBTP is a reasonable test, and Spotify asks for it above -14 LUFS. If you deliver an AAC or MP3 version yourself, decode it and measure that file, not just the WAV. Apple's afclip command-line tool, described in its Apple Digital Masters brief, checks an encoded file for clipping.
How to set and check true peak in a session
- Limit on the true peak. Use a limiter whose ceiling is set in dBTP and detects inter-sample peaks. A limiter set to -1 dB on a sample peak output is not enforcing -1 dBTP.
- Keep it last. Anything after the limiter that changes level or filtering can change the peaks. Dither is the exception: it adds noise far below the ceiling, as our dither guide explains.
- Convert sample rate before the limiter.Sample rate conversion reconstructs the waveform, which can create overs from a file that read clean. If you must convert afterward, measure again.
- Render the tail. A lookahead limiter delays the audio slightly, so its last moments come out after the input has ended. Cut the export at the exact length of the input and a loud ending stops dead, and an abrupt stop is itself a shape that can overshoot. Let your host render the plugin's tail.
- Measure the export. Read integrated LUFS and true peak on the file you will deliver with the loudness and true-peak meter. If you encode it, measure the decoded result too.
Is sample peak still useful?
Yes, for different questions. A run of consecutive samples at or near full scale is a sign of digital clipping already printed into the file, and that is a sample-domain question. Sample peak also tells you what a fixed-point file can store. But for the question “will this clip on playback or after encoding?” true peak is the reading to trust.
Where Clearwall fits
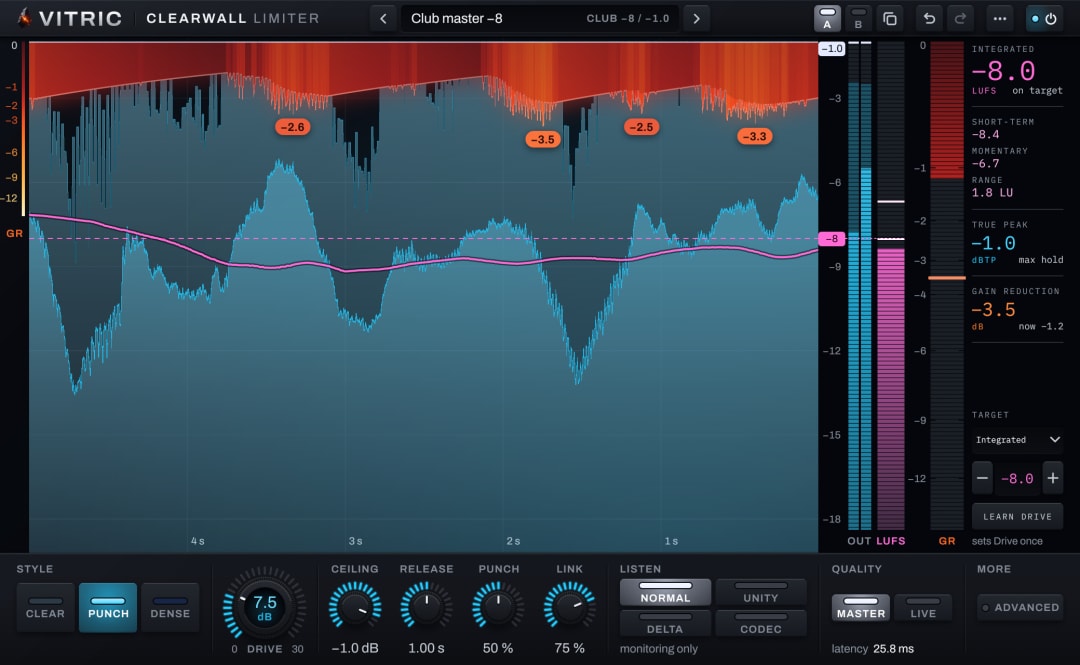
Clearwall Limiter sets its ceiling in dBTP, from -12 to 0. An 8x detector drives the gain, and a final verify stage checks the output before it leaves the plugin. On 16 test mixes at -8 LUFS, the worst true peak measured over the ceiling at 32x was 0.0012 dB in its Master quality. Its opt-in Codec margin holds the ceiling 1 dB lower while the short-term loudness is above -14 LUFS, and on macOS its Codec listen mode plays the output through an AAC 256 kbps encode and decode so you can hear the result. The LUFS targets guide covers the loudness side of the same decision, and the Clearwall build story explains the detector and verify stage in more depth.
Sources and further reading
- ITU-R BS.1770-5: algorithms to measure loudness and true-peak level (Annex 2).
- EBU R 128: loudness normalisation and permitted maximum level.
- EBU Tech 3343: production guidelines for R 128.
- EBU Tech 3344: distribution and reproduction guidelines.
- AES TD1004.1.15-10: loudness of audio streaming and network file playback.
- Spotify for Artists: loudness normalization.
- Apple Digital Masters technology brief.